Forward
Today we have a guest blog post from one of Jisc’s data science apprentices, Eleni Apostolopoulou. It’s more technical than our usual posts, but we’ve seen a lot of interest in the detail of how exactly AI can be used with existing data to solve problems, so we thought it would good to share a practical example.
You’ve probably also seen a lot of talk about AI might be able to help solve the climate emergency as well as contribute to it – this is a great example of that, albeit on a small scale.
Michael Webb, Co-lead of Jisc AI Team
Researching Jisc’s Website Carbon Footprint Using Machine Learning Techniques
One of the factors that often gets overlooked when considering an organisation’s energy efficiency is its online presence. As a website’s energy consumption and carbon emissions are not obvious, people sometimes assume that they are negligible compared to other more obvious culprits, like our commute to work or electricity usage.
One of Jisc’s current main focuses is to align itself with the UN sustainability goals and as part of this is trying to reduce its carbon footprint. To this end, we started looking at the carbon emissions produced by Jisc’s web presence. Our intention was to group all the pages viewed in the period between 01.09.20 and 01.09.21 into clusters and see which ones were the least energy efficient. We then looked into what elements of the pages had the greatest impact on their carbon footprint and ultimately, what could be done to improve them. This post summarises the work we have done so far and suggests what could be done next. Jisc is also in the process of redesigning their website, so we can see how changes already made have impacted our carbon emissions.
Wait, how do web pages contribute to carbon emissions?
The average web page tested produces 1.76 grams CO2 per page view. For a website with 10,000 monthly page views, that’s 211 kg CO2 per year (source : https://www.websitecarbon.com/) According to statistics from Clever Carbon, that is equivalent to approximately a 2-hour flight. Thus, looking at websites is something that needs to be considered if Jisc is going to reduce its carbon footprint.
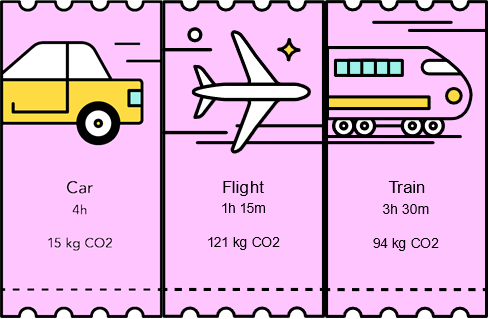 Source: Clever Carbon
So what are the main things that contribute to each Main things contributing to each page’s energy efficiency? The key features are:
- Data transfer over the wire
- Energy intensity of web data
- Energy source used by the data centre
- Carbon intensity of electricity
- Website traffic
When a person accesses one of our pages, the data they need gets transferred over the wire to their machine. The energy used for loading a web page is roughly proportional to the amount of data that is transferred over the wire. Repeat visitors may transfer less data as they may have website assets stored on their devices. The amount of energy used per Gigabyte varies for every website and every user but for the calculations that have been used in our report, the creators of the calculator have taken an average by dividing the total amount of energy used in a year for transferring data over the wire by the total annual data transferred. The result is kilowatts-hours per GB.
The carbon calculator also takes into account whether the data centre being used is using green energy or not. Jisc.ac.uk is hosted by a company using green energy. The carbon intensity of grid electricity is based on the international average as reported by the International Energy Agency.
Finally, this information will give us an idea of emissions from an average user visiting a web page once. To calculate the total CO2 emissions for the whole year we multiply the carbon per page by the number of pageviews in that time period.
For this project we are not considering things that stay constant over all webpages, such as the location or types of servers the website is on. Those aspects are part of a larger effort taken on by the web team. For this, we simply wanted to look at the contribution to carbon emissions specifically caused a web page’s content.
How are we collecting the data?
Each page’s URL and traffic for the period we are examining have been extracted directly from Google Analytics. Writing an automated script in python, 2956 of Jisc’s web pages were entered into the Carbon footprint calculator.
Using Google’s open-sourced Lighthouse, we also collected size of data transferred over the wire for the same pages. Specifically, we collected size of images, Stylesheets, JavaScript, fonts and overall page size. We also gathered information on the number of different types of images used, whether they were jpeg, png or svg.
So how is Jisc doing?
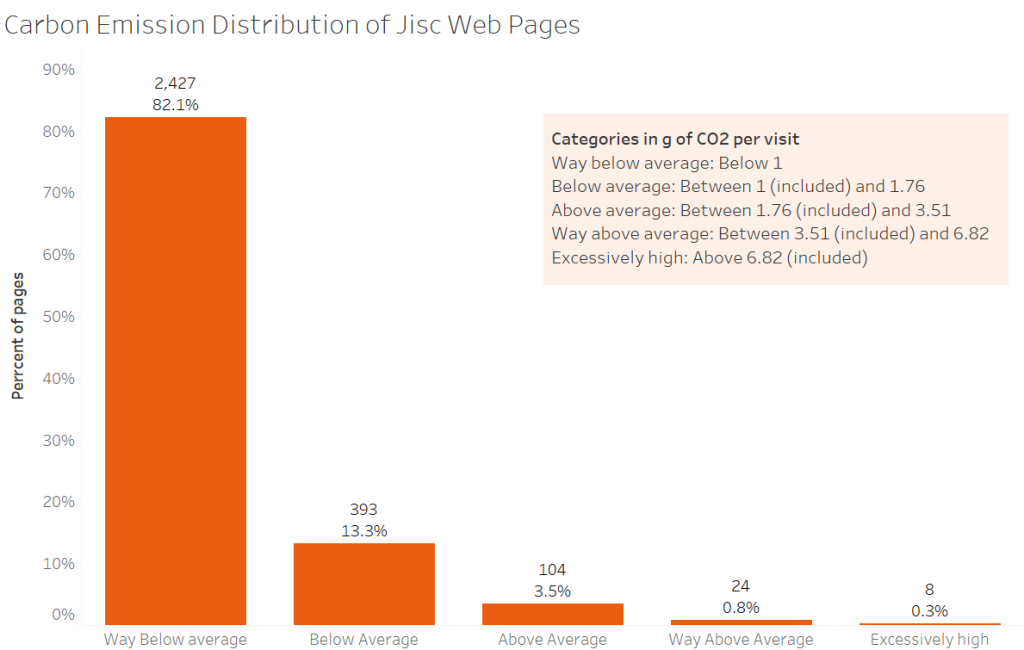
Overall, we can see that Jisc is quite energy efficient, with 95.4% of our pages being below the average 1.76 grams CO2 per page view, mentioned above.
However, as stated above its not just the page but the number of times the page is visited that contributes significantly to the total carbon emitted over the year. To do this we multiplied each page’s carbon emissions per visit with the number of annual visits to get the total annual carbon for the page.
Identifying where to focus
So, in order to form a plan of action, it was important to see which pages had a high number of total emissions as these needed to be tackled first.
A high number of total emissions could be due to:
- Pages with a low per visit carbon emission but high number of pageviews
or
- Pages with high per visit carbon emission and low number of pageviews
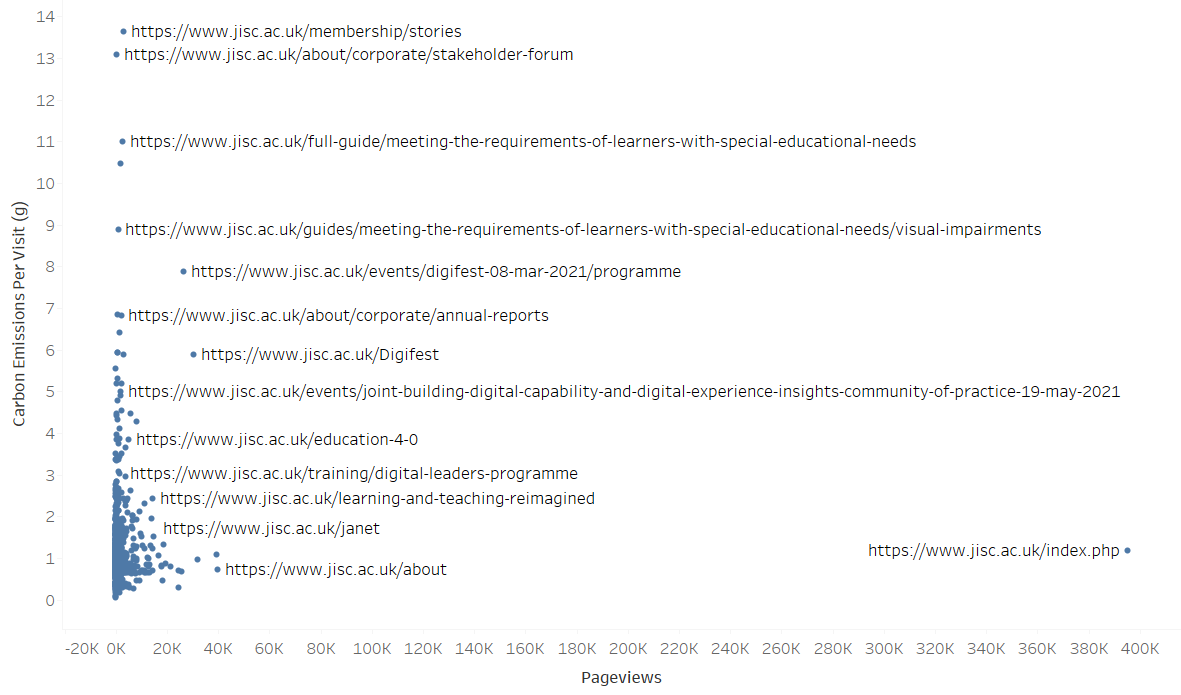
As shown in the image above we plotted the emissions per visit against the number of page views and found, luckily, Jisc has no pages with high number of pageviews and high carbon emissions per visit!
Although the image does show us pages that have high carbon emissions per visit, regardless of their total carbon emissions over the period of a year.
Because we can’t judge which pages have a larger impact on total annual carbon just by looking at pageviews and carbon emissions per visit, we clustered our data, taking into account total annual carbon emissions and per visit carbon emission – shown in the diagram below.
Outliers
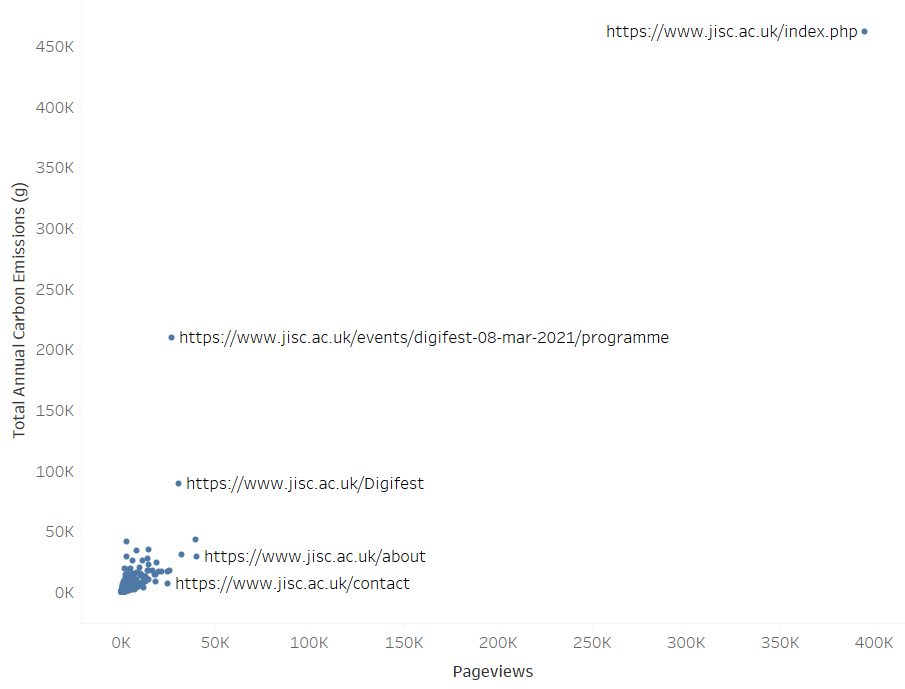
The first thing we looked at is the total carbon each of our pages produce to see if we have any pages that stand out.
Straight away we saw that we have some outliers.
- Our landing page emits at over 450Kg of carbon a year, but that can be attributed to the high number of pageviews it receives.
- The Digifest page emits around 90kg of carbon a year, which is on the high end but still below average.
- The 2021 Digifest programme page is at around 210kg a year, which is strange as it has a reasonable amount of traffic but not an amount that can justify those numbers. Looking at the page closely we found that 7.88g of carbon is emitted every time someone visits this page. By visiting this page, we can see a large number of embedded videos which could be the reason, but we address this aspect further in the study.
Because the high values from these pages will distort the results of our clustering analysis and because we have an understanding as to what is causing these high numbers, we removed them to be able to get a better look at the rest of our pages. We are using clustering to group by the volume of carbon emissions. We can then analyse the pages in the group and see what they have in common that might cause this volume.
Clustering
Clustering by hand can be time-consuming given the number of pages and the number of variables. This is where unsupervised machine learning comes in handy. We specifically employed a K-Means clustering algorithm using python to break our data into groups. The K-means algorithm mathematically identifies a k number of cluster centroids in the data and allocates each data point to the nearest cluster. For our specific problem it does this by taking into account the carbon emissions per visit and the total annual carbon emissions for each page.
After some analysis of the algorithm, the number of clusters that gave the most cohesive groups is 7. These can be seen below.
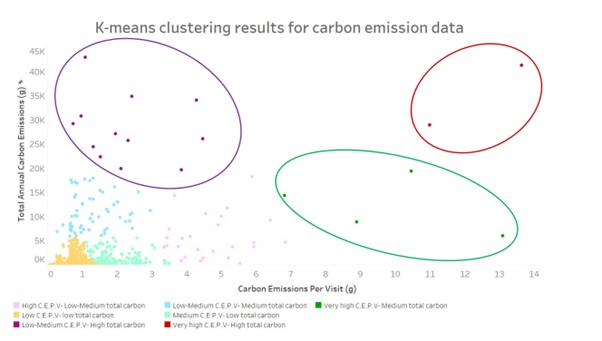
We chose the cluster names manually, so that they have meaning and describe the data that they include.
The clusters that we are interested in are:
- Low-Medium carbon emissions per visit (C.E.P.V) – High total carbon emissions
- Very high carbon emissions per visit – High total carbon emissions
- Very high carbon emissions per visit – Medium total carbon emissions
Least energy efficient pages
Specifically, pages in the least energy-efficient groups are:
| Cluster Name | Page | Pageviews | C.E.P.V | Total Annual carbon |
| Low/Medium C.E.P.V- High total carbon | https://www.jisc.ac.uk/jobs | 39,394 | 1.09 |
43kg |
| https://www.jisc.ac.uk/learning-and-teaching-reimagined | 14,389 | 2.42 |
35kg |
|
| https://www.jisc.ac.uk/events/networkshop49-27-apr-2021/programme | 7,966 | 4.28 |
34kg |
|
| https://www.jisc.ac.uk/online-surveys | 32,066 | 0.96 |
31kg |
|
| https://www.jisc.ac.uk/about | 39,954 | 0.73 |
29kg |
|
| https://www.jisc.ac.uk/learning-and-research-resources | 13,913 | 1.95 |
27kg |
|
| https://www.jisc.ac.uk/full-guide/developing-digital-literacies | 5,851 | 4.46 |
26kg |
|
| https://www.jisc.ac.uk/govroam | 11,087 | 2.32 |
26kg |
|
| https://www.jisc.ac.uk/janet | 18,483 | 1.32 |
24kg |
|
| https://www.jisc.ac.uk/rd/projects/building-digital-capability | 14,685 | 1.52 |
22kg |
|
| https://www.jisc.ac.uk/security-conference | 9,422 | 2.11 |
20kg |
|
| https://www.jisc.ac.uk/education-4-0 | 5,101 | 3.85 |
20kg |
|
| Very high C.E.P.V- High total carbon | https://www.jisc.ac.uk/membership/stories | 3,029 | 13.64 |
41kg |
| https://www.jisc.ac.uk/full-guide/meeting-the-requirements-of-learners-with-special-educational-needs | 2,634 | 10.99 |
28kg |
|
| Very high C.E.P.V- Medium total carbon | https://www.jisc.ac.uk/full-guide/transforming-assessment-and-feedback | 1,854 | 10.46 |
19kg |
| https://www.jisc.ac.uk/about/corporate/annual-reports | 2,108 | 6.82 |
14kg |
|
| https://www.jisc.ac.uk/guides/meeting-the-requirements-of-learners-with-special-educational-needs/visual-impairments | 996 | 8.89 |
9kg |
|
| https://www.jisc.ac.uk/about/corporate/stakeholder-forum | 459 | 13.09 |
6kg |
|
| None- Removed before clustering | https://www.jisc.ac.uk/index.php | 39,124 | 1.17 |
462kg |
| https://www.jisc.ac.uk/digifest | 30,448 | 5.88 |
90kg |
|
| https://www.jisc.ac.uk/events/digifest-08-mar-2021/programme | 26,653 | 7.88 |
210kg |
Just these 21 pages emitted approximately 1200kg of carbon in the year that we examined! That is over a metric tonne!
To put these numbers into context, according to the Clever Carbon image shown at the beginning, the annual visits to these pages are equivalent to a 10 hour flight, more than it would take to travel form NY to London.
Why do these pages have higher carbon emissions?
For the second part of our research, we conducted a correlation analysis to see which features impact the carbon emissions per visit the most.
We found that the features more closely correlated with the carbon emissions per visit in order of impact are:
- The total page size. All in all, all elements combined will affect the page’s carbon emmission.
- Size of font package.
- Size of the JavaScript code that is included in the page.
- Size of images
- Specifically the size specifically of the jpeg images.
We also saw that Stylesheet sizes are very weakly correlated but still contribute to the total page size so should also be kept to a minimum if possible.
Possible causes and solutions
It is important when thinking about possible solutions to strive to maintain a balance between usability and efficiency. We still want our web pages to be enjoyable and easy to use. We could very well take out all the pictures, videos and interactive elements but then the pages would not be aesthetically pleasing or easy to read.
Keeping that in mind, let’s look at the different elements of Jisc pages that impact energy consumption and what can be done to minimise the impact.
Fonts
Jisc uses Roboto fonts which are not built in with Windows. This means that every time a new user accesses our website these will have to be downloaded which explains the high impact.
Jisc however, also uses Woff2 font format which is a good practice. Woff2 is a specific type of font format that provides a 30% reduction in file size.
JavaScript
Large chunks of JavaScript code consume a large amount of energy and often portions of it go unused. Certain pages, on the Jisc website, contain a number of embedded YouTube videos, as we mentioned, that load the relevant JavaScript for every visitor, regardless of whether the users chose to watch the videos or not. It is worth looking at new technologies which only load the javaScript elements when the user gets to that point on the page.
Image Formats
As a general rule jpeg images are better for large images, and you can achieve fairly low sizes when using them. On the other hand, png (Portable Graphics Format) file formats are used when transparent images are needed. The downside to this is that a png file format will be a significantly larger size than it would as a jpeg. For this reason, extra care should be taken when using the former file size. Alternatively, we could consider using modern image formats such as WebP which offers better compression and supports transparency.
Stylesheets
Cascade Style Sheets seem to be having some impact on our pages, although not as much as the aforementioned factors. Large CSS files with unused CSS rules consume a large amount of energy. A possible solution could be creating better-tailored CSS files for pages with a higher number of pageviews.
Page caching
Page caching effectively stores a copy of a web page framework closer to the user so the data has less distance to traverse and consequently less energy is consumed.
What is being done
Many of these issues are being addressed in Jisc’s website redesign. Important steps we’ve taken include:
- Moved from Drupal, a traditional content management system (CMS) to Wagtail a headless content management system making the website’s HTML fully controlled and kept to a minimum.
- Implementing React JS, an open-source JavaScript library that allows elements on a page to be updated/loaded only when a user interacts with them.
- A cache has been added so that a static version of pages is available.
From these changes alone, we have seen a massive improvement on the redesigned page’s carbon emissions. An example is our jobs page which previously emitted 1.09 grams of carbon per visit, now emits 0.30 grams of carbon; a 72% reduction!!! in carbon emissions.
With people spending more and more time online in all aspects of their lives, it is important to understand the effect our digital footprint can have on the environment and prioritise energy efficiency. We’ve shown that this effect is not negligible in comparison to other more familiar culprits of carbon emissions, but simple changes in how we design our website can have a tremendous difference in our carbon footprint.
Find out more by visiting our Artificial Intelligence page to view publications and resources, join us for events and discover what AI has to offer through our range of interactive online demos.
For regular updates from the team sign up to our mailing list.
Get in touch with the team directly at AI@jisc.ac.uk
One reply on “A case study: Using machine learning to analyse Jisc’s Website Carbon Footprint”
Wow!! I have never considered the energy consumption of surfing the internet. A very informative article, thank you Eleni and Jisc for all you hard work on reducing our carbon footprint in ways a vast majority of the population has yet to even. consider.