
We are often asked about how we integrate AI into our everyday tasks and how it helps us to work more efficiently. While generative AI serves various purposes, one helpful function we’ve discovered is its assistance in navigating Microsoft Excel, whether that be providing step by step guidance on formulas or describing complex tasks. For those who haven’t delved into Excel for some time, identifying the right formulas for your data can be a challenge. This is precisely where generative AI can help us. This blog will dive into some of our firsthand experiences, leveraging the capabilities of both ChatGPT 3.5 and GPT 4, the GPT store and Gemini Advanced.
Catherine’s experiences
Context
I’ve used generative AI to help create formulas and graphs, as well as a tool for understanding the functionality of formulas. One of the main challenges I’ve encountered with Excel is determining which formulas are the most effective for achieving specific results. I’ve tried online courses and YouTube videos before, but I always found the information didn’t stick and typing notes was really time consuming. I’ve also noticed that courses often include a lot of information that isn’t directly applicable to the work I’m doing. This is where generative AI really steps up. I’m able to ask specific questions and get specific answers. It’s genuinely like having an Excel expert at hand 24/7.
ChatGPT 3.5
ChatGPT 3.5 was the tool that I first turned to for help with Excel. I had a lot of data and needed guidance on how to initiate its analysis. I began by asking it questions in the same way I would with a colleague or a friend and I found its responses to be remarkably helpful. More importantly, the data it returned appeared accurate and in the times that I needed additional clarification to understand why a particular formula had given certain results, I asked it to explain again, or even to explain it to me ‘like I was 10 years old’. Although this can result in an overly simplified explanation, it is a really beneficial tactic.
Here is a simple, yet effective example.
This was my prompt:
“You are a proficient Microsoft Excel user and teach beginner Excel users how to use and understand the programme. Please begin by explaining what the formula ‘COUNTIF’ is used for and give 3 examples of when you may use this formula”.
The output began with a short summary:
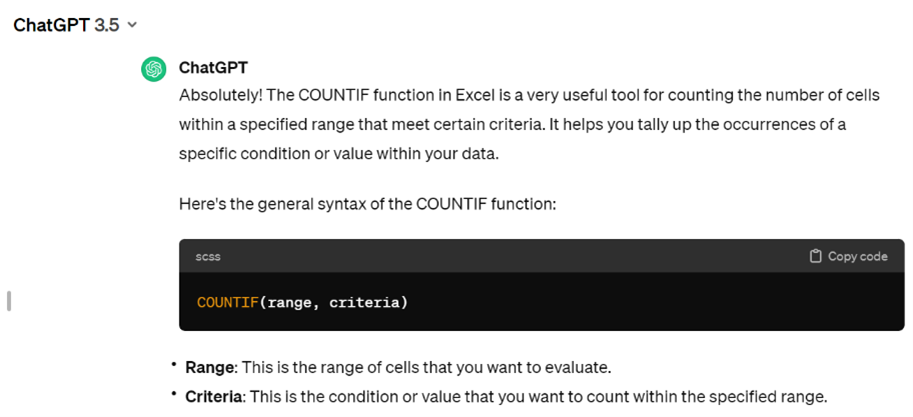
It also included three examples of COUNTIF in action – ‘Counting Occurrences of a Specific Value’, ‘Counting Cells Based on a Condition’ and ‘Counting Cells with Text Criteria’. Each provided the exact formula that I could paste into Excel, along with a description.
In every instance I asked questions, I found the output extremely useful and appreciated that it had no judgement. I was able to ask questions over and over until I felt I understood, which I may have hesitated to do with another person. I also liked that I could digest the information at my own pace, something that I found more challenging to do when following a course.
Limitations
One drawback I experienced while using the tool was that it could be quite slow. This, coupled with errors in generating responses sometimes led to delays in receiving answers. However, it’s worth noting that this didn’t happen every time, and such issues are typically expected with the free version.
Google Gemini Advanced
I also wanted to test Google Gemini Advanced. There is currently an option to try a 2-month free trial so if you are interested you can sign up here. I was curious to see if utilising the more powerful tool would help me further. I used it in the same way I used ChatGPT 3.5, primarily aiming to expand my understanding of formulas and how I can extract data. The first thing I noticed was how quick it was, there were no errors in generating responses which I’d experienced with the free ChatGPT 3.5 tool. I found it to be really user-friendly with a clear and easily readable userface. Overall, it’s responses were helpful and well-explained.
I used the same prompt that I used with ChatGPT 3.5 previously. The output began with:
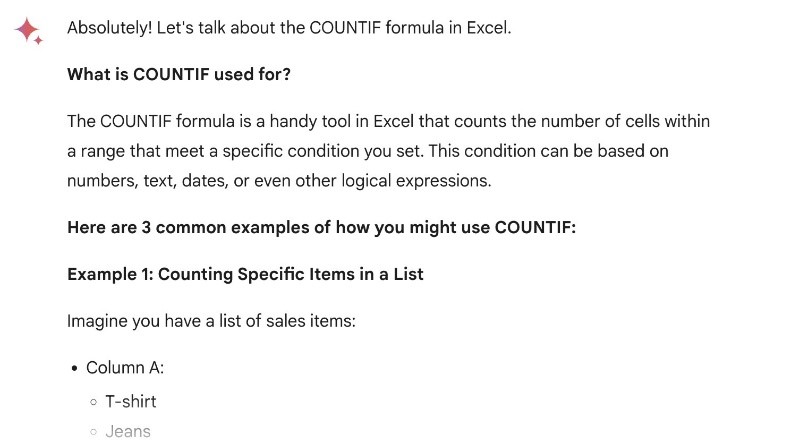
It then gave three examples of COUNTIF in use, which included the above ‘Counting Specific Items in a List’, ‘Counting Numbers Based on Criteria’ and ‘Counting with Text Criteria’. Similarly to GPT 3.5, each provided the exact formula that I could paste into Excel, along with a description.
Fact checker
Another aspect I really like about Gemini Advanced is the option to double check responses. It uses Google Search to find content that’s likely similar to or different from generated statements. This actually proved helpful as it had provided some incorrect information around COUNTIF being case-sensitive. If the fact checker hadn’t flagged the mistake, I might not have double-checked my sources.
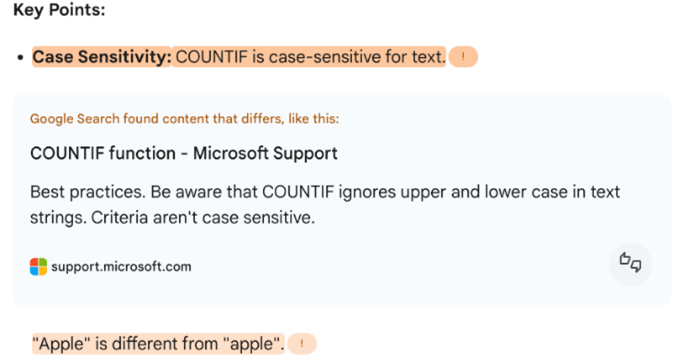
It served as a reminder for me to always verify information, which I consider to be a positive outcome.
Limitations
Unfortunately, I encountered a limitation where I couldn’t upload data for the tool to generate graphs or charts on my behalf. When I asked, it responded with: “Unfortunately, I can’t directly upload and process an Excel spreadsheet to create a pie chart for you. Here’s why:
- No File Input: As a language model, I primarily work with text and code. I don’t have a way to natively handle file uploads or interact with Excel’s interface.”
Although this was disappointing, it did offer to guide me though the process of creating a pie chart myself using Excel, which was useful.
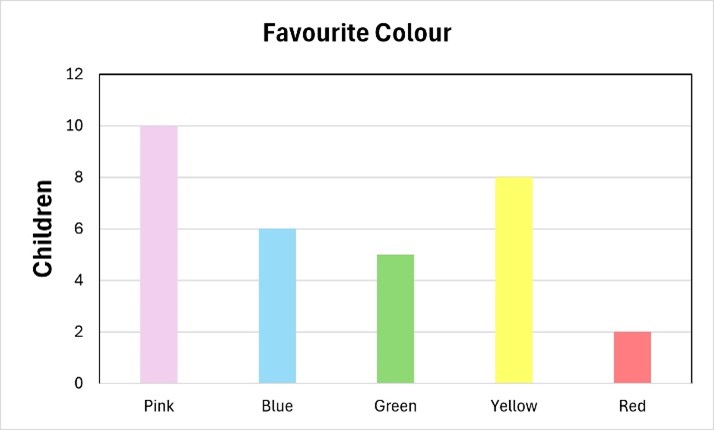
The tool is also multimodal, allowing for diverse interactions. I uploaded images of a simple bar graph and asked it to describe the data.
Unfortunately, the response was incorrect:
“The bar graph you sent me shows the number of children who chose a certain color as their favorite. The x-axis shows the different colors, and the y-axis shows the number of children who chose that color. The title of the graph is “Favourite Colour”.
Here is a list of the colors and the number of children who chose them:
- Pink: 0
- Blue: 8
- Green: 0
- Yellow: 10
- Red: 2
According to the graph, the most popular color among children is yellow, with 10 children choosing it. Blue is the second most popular color, with 8 children choosing it. Green and pink are the least popular colors, with no children choosing them.”
I would be interested to know whether other users have found similar issues.
A final limitation to note, albeit unrelated to using it for help with Excel, was that I couldn’t try the image generation tool. Currently, this feature is not available in the EEA, Switzerland, and the UK (see link to Google here). Hopefully, this will be something we can test at a later date.
Helen’s experiences
ChatGPT Plus
I am fortunate to have access to ChatGPT plus which uses the GPT-4 model and includes additional features like being able to upload files for interpretation and generate images with DALL E 3.
Like Catherine, I’ve found ChatGPT to be a helpful support tool for Excel. Below I’ve explored some of the additional capabilities that come with GPT plus and how I’ve found using them.
Note: the links provided in this section for specific GPTs will only be available if you are also a ChatGPT plus user.
Up to date information
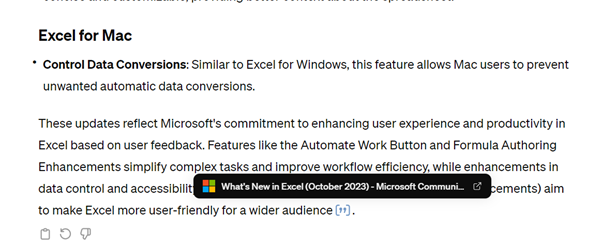
A key benefit of ChatGPT 4 over 3.5 is that it is more up to date and can also access the web for further information. As Excel continues to receive updates this was helpful as GPT 3.5’s information currently goes up to January 2022 only.
Knowing the latest capabilities of Excel is particularly helpful as I find ChatGPT is useful to ask general questions about the software as well as problem specific ones. For instance, I’ve asked for a summary of the latest updates, or for a list of handy keyboard shortcuts.
Helpfully GPT-4 can also provide some referencing if it does use a web search to support its answer. Hovering over the quotation marks at the end of an answer will link you to the source it has used. As a user this improves my confidence in the answer but can also open up new sources for knowledge, in some cases I’ve discovered other useful web resources for Excel because GPT has referenced them.
GPTs
OpenAI also recently launched it’s GPT store – a place to access GPTs which have been customised by other Plus users. These GPTs are finetuned for more specific uses and I found quickly that there were quite a few available for Excel support. If anything, though the amount of very similar looking GPTs for Excel did feel a little unhelpful as they all look to have the same offering and several even the same name ‘excel’.
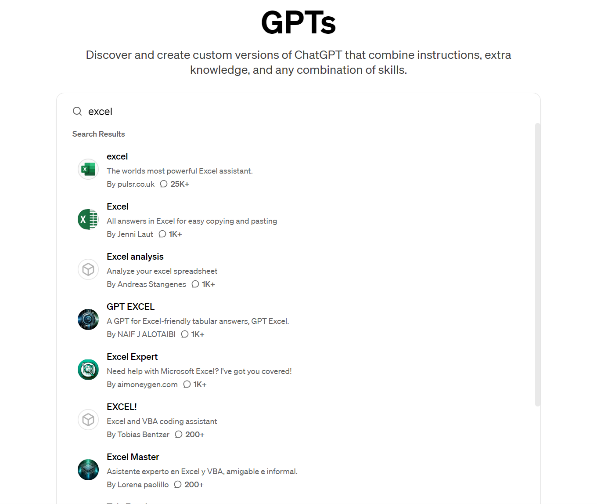
Fortunately, within the search feature GPTs are listed by the number of conversations users have had with them so you can try to find a more capable GPT based on the amount of use it has had.
Clicking into a GPT also reveals its user rating and roughly the number of ratings it has had.
I have largely been using a mix of the ExcelGPT and the standard GPT-4 but did try out a couple of the top rated Excel GPTs including excel, Excel Maestro.
Prompt interpretation
I am continually impressed at how good GPT-4 is at interpreting prompts concerning Excel, even when they were not phrased well. For novice users of Excel it can be quite difficult to word what exactly you want to do with your data.
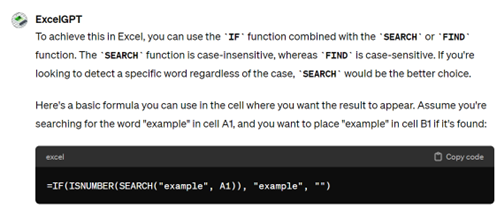
I played around with how far this could go by using a poorly worded prompt, and got excellent results from ExcelGPT:
“In excel how do we do if a cell contains a word then put this word in cell next to it”
For this prompt I was looking for a method that would search a list of values for a word and if that word was present in the list it would input that word into the cell next to it.
ExcelGPT handled my confusing prompt very well, immediately suggesting a correct method using the IF and Search functions.
Multimodal features
With a plus account you can provide an excel file directly to ChatGPT and this opens up more opportunities.
Interpreting data
I have experimented with providing graphs and charts to GPT plus and asking for a transcription of the data or some analysis. This can be really helpful to support the writing of alternative text which can be particularly difficult and time consuming to create. The results can be variable though and I wouldn’t rely on GPTs interpretations, but they can be interesting and potentially help a user look at their data in a new way.
As an example, I provided the bar chart of children’s favourite colours given to Gemini:
“Certainly! This bar chart represents the favorite colors among a group of children. The vertical axis (y-axis) indicates the number of children, and the horizontal axis (x-axis) lists the colors: Pink, Blue, Green, Yellow, and Red. Each bar’s height corresponds to the number of children that prefer that particular color.
- Pink: The tallest bar, indicating that pink is the favorite color of 10 children.
- Blue: The second tallest bar shows that 5 children prefer blue.
- Green: The third tallest, with 4 children choosing green as their favorite color.
- Yellow: The second most popular color, with 7 children preferring yellow.
- Red: The least popular among the group, with only 2 children favoring red.
From this chart, we can conclude that pink is the most popular color among the children surveyed, while red is the least popular.”
GPT plus, like Gemini, got a lot of the actual numbers incorrect. The description and conclusions on the data are correct though, and again could be usefully edited into descriptions/alt text.
Results seem to vary a lot between images, GPT actually did quite a good job with the scatter graph, producing a fairly accurate description and some basic analysis.
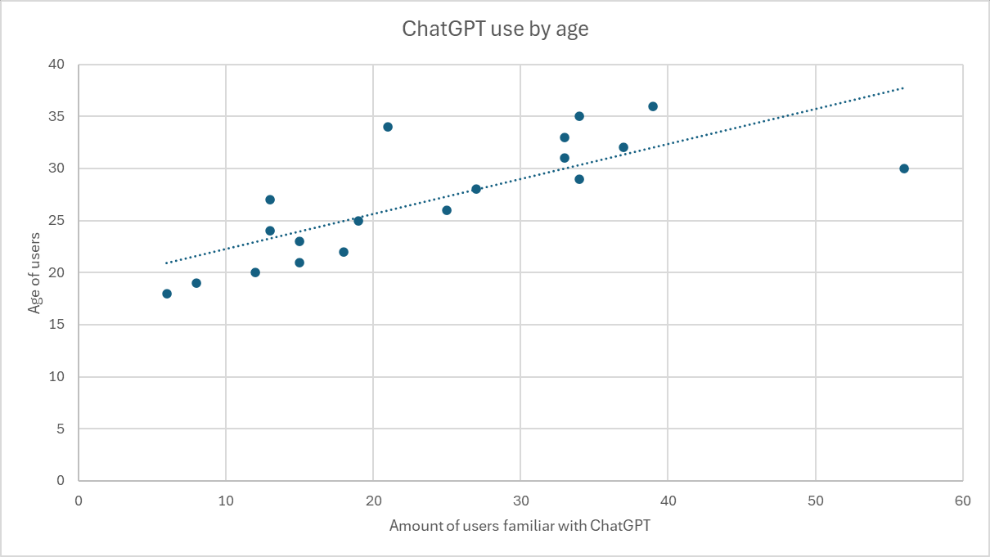
“- The graph shows a positive correlation between age and the number of users familiar with ChatGPT.
– The trend line indicates that as age increases, the likelihood of being familiar with ChatGPT also increases.
– The middle age range seems to have the highest concentration of users familiar with ChatGPT, as evidenced by the clustering of data points around the trend line.
– The data points become more sparse at the younger and older ends of the age spectrum, suggesting less consistency in familiarity with ChatGPT among these age groups.
– The graph does not show the complete picture for very young or very old ages, as there are fewer data points in those ranges.”
– GPT4 Output
Generating charts/graphs
I also tried using GPT-4 to generate charts from a file and while I wouldn’t say this is going to replace the actual chart feature in Excel, it was quite impressive.
I provided GPT-4 with my data, statistics on AI use by location, which was in a table format and prompted it to create a simple pie chart: “using this data can you create a pie chart showing the distribution of All interactions (column H) by Location (column E)”
The output (chart A) was initially disappointing – leaving the colour choices to GPT-4 was certainly a mistake. It used varying shades of green with black text, making the chart very inaccessible for visually impaired and colourblind viewers. As well as this it used the exact same shade of green for the England and Wales segments which is very unhelpful in a pie chart.
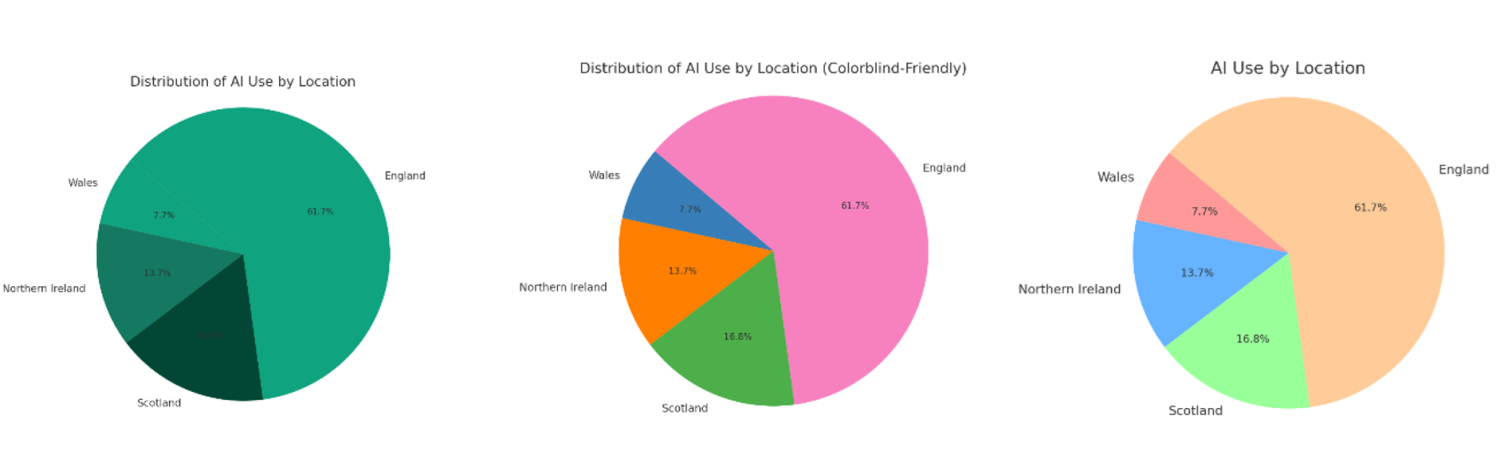
Though the visuals required further prompting there were no errors in the data, GPT correctly calculated the percentages and segment sizes each time.
I could also improve the generated chart easily by adding more context and direction to my prompt. I asked for a new version (chart B) with an accessible colour palette and the results were improved with distinct colours in each segment. I also found several GPTs customised for graph and chart making, trying the same prompt for the pie chart above with chart maker GPT resulted in Chart C which used an appropriate colour scheme right off the bat.
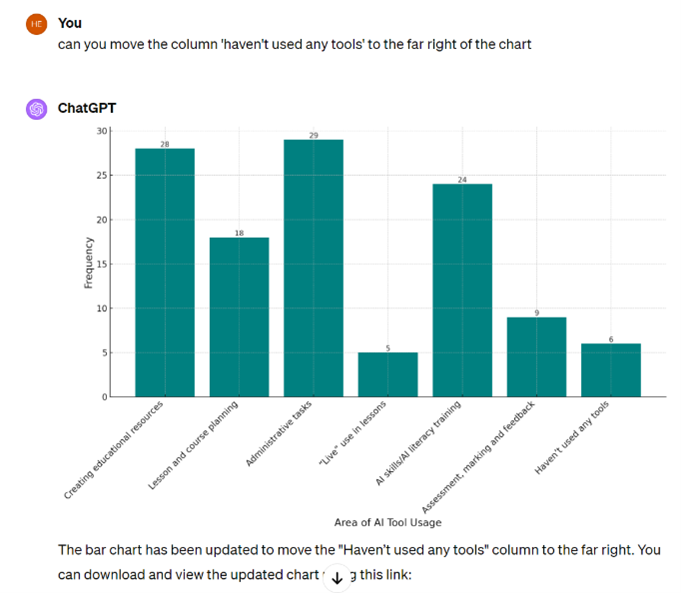
I also had good results with other chart types and found it particularly helpful that I could ask GPT to move elements around for me which felt less clunky than doing this in Excel itself. For example, moving the order of bars in a bar chart when the original data wasn’t in the preferred order:
Were the custom GPTs better overall?
I do find it hard to say overall if the custom GPTs I tried were more effective than just using GPT-4. The chart generation GPT showed some clear improvements in generating an acceptable chart but there wasn’t much difference to me when using text prompts. I tried several prompts in both GPT-4 and ExcelGPT and received the same advice from both.
Of course, my experience is limited and there are a range of Excel specific GPTs I haven’t yet tried out. I do expect though that GPT-4 will have had a large amount of Excel related content to train on as well as having up to date internet access which perhaps makes it quite competent with Excel related queries already without being finetuned. Perhaps also though, as quite a novice user of Excel, my prompts just haven’t yet been complex enough to benefit from that finetuning!
Conclusions
We’ve found that generative AI can serve as a fantastic support tool. Streamlining tasks, saving time and helping us to enhance our own knowledge and skills. As always, we need to be aware of the limitations of these tools too and evaluate their outputs thoroughly. While this blog primarily focuses on Excel, the principles discussed could be applied to various programs and situations, both professionally and personally.
Are you using generative AI tools to support your personal or professional life? Share your experiences with us in the comments below—we’d love to hear from you!
Find out more by visiting our Artificial Intelligence page to view publications and resources, join us for events and discover what AI has to offer through our range of interactive online demos.
For regular updates from the team sign up to our mailing list.
Get in touch with the team directly at AI@jisc.ac.uk